WELCOME TO

Led by data visualisation expert and 2024 Iron Viz champion, Chris Westlake, this blog is your one-stop-shop for insights, tips, and techniques on crafting compelling narratives through data visualisation.
Whether you're a seasoned data professional or a budding enthusiast, there's something here for everyone at Westlake Analytics. Dive in and unleash the power of visual storytelling with data!
Join us as we explore the intersection of analysis, design, and storytelling in the world of data visualisation, drawing inspiration from Chris's award-winning dashboards created with Tableau.

From the blog…
-
![]()
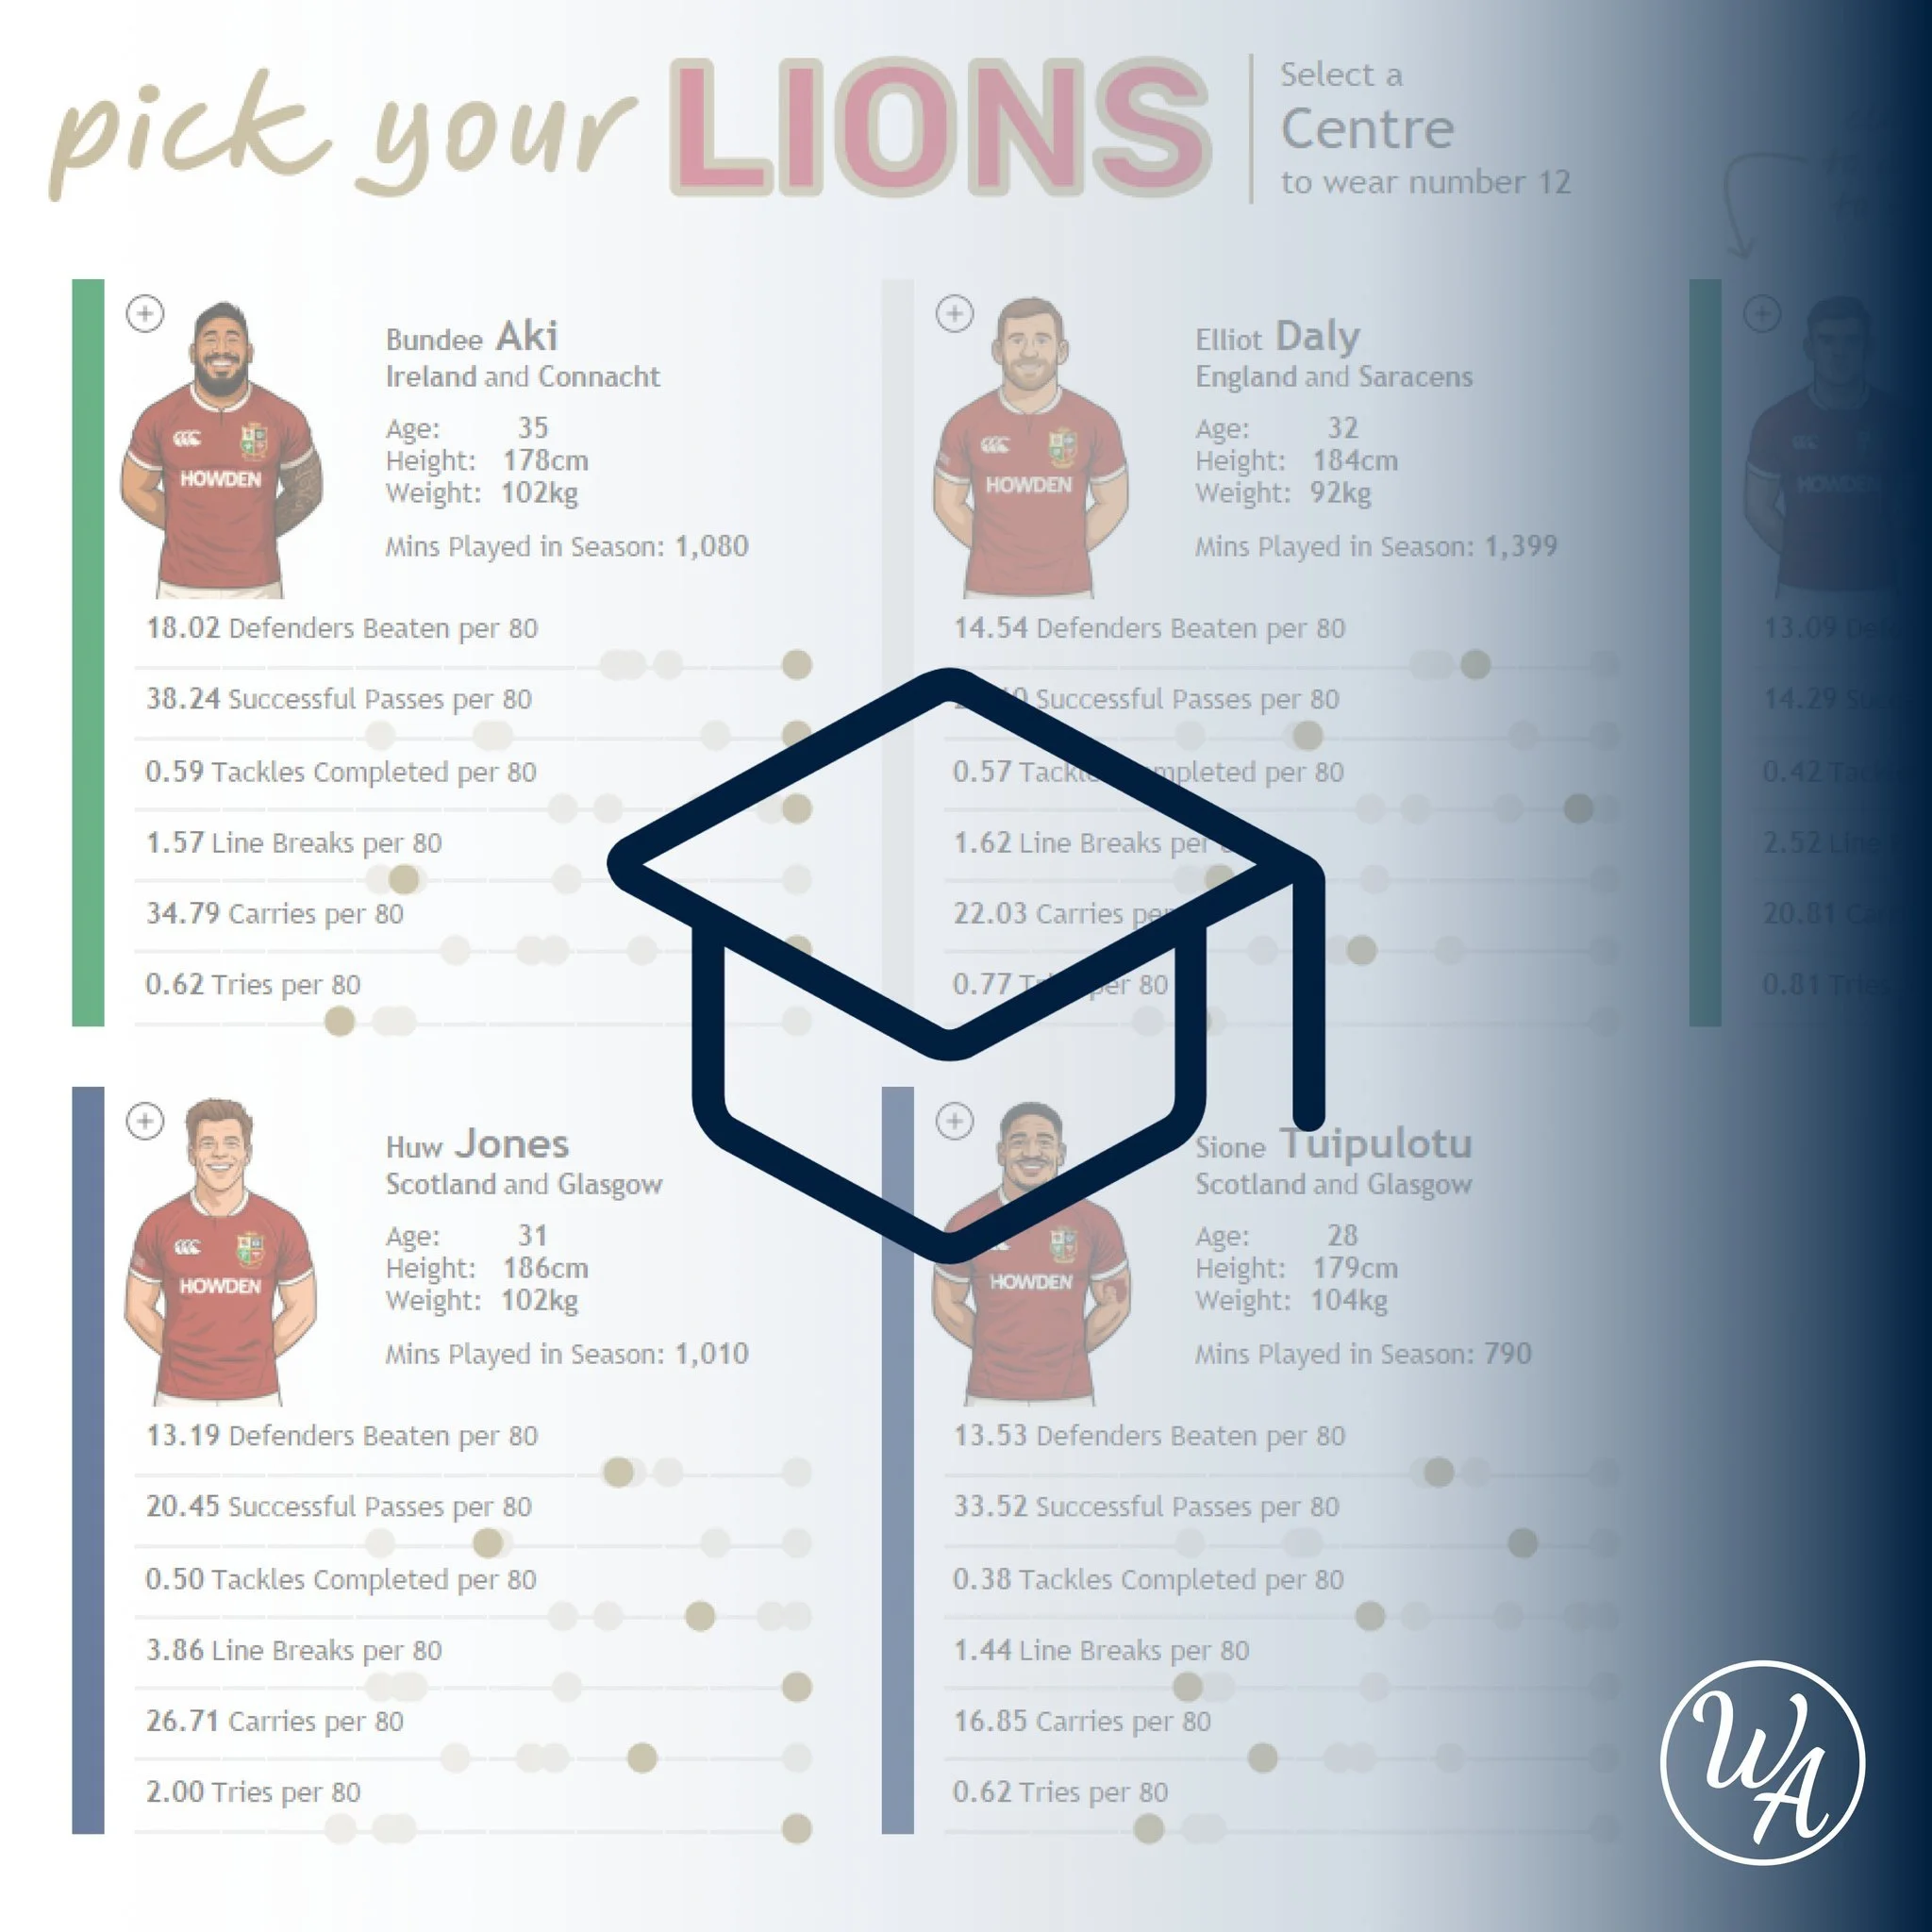
Behind the Viz | Pick Your Lions
-
![]()
Reflecting on TC25
-
![]()
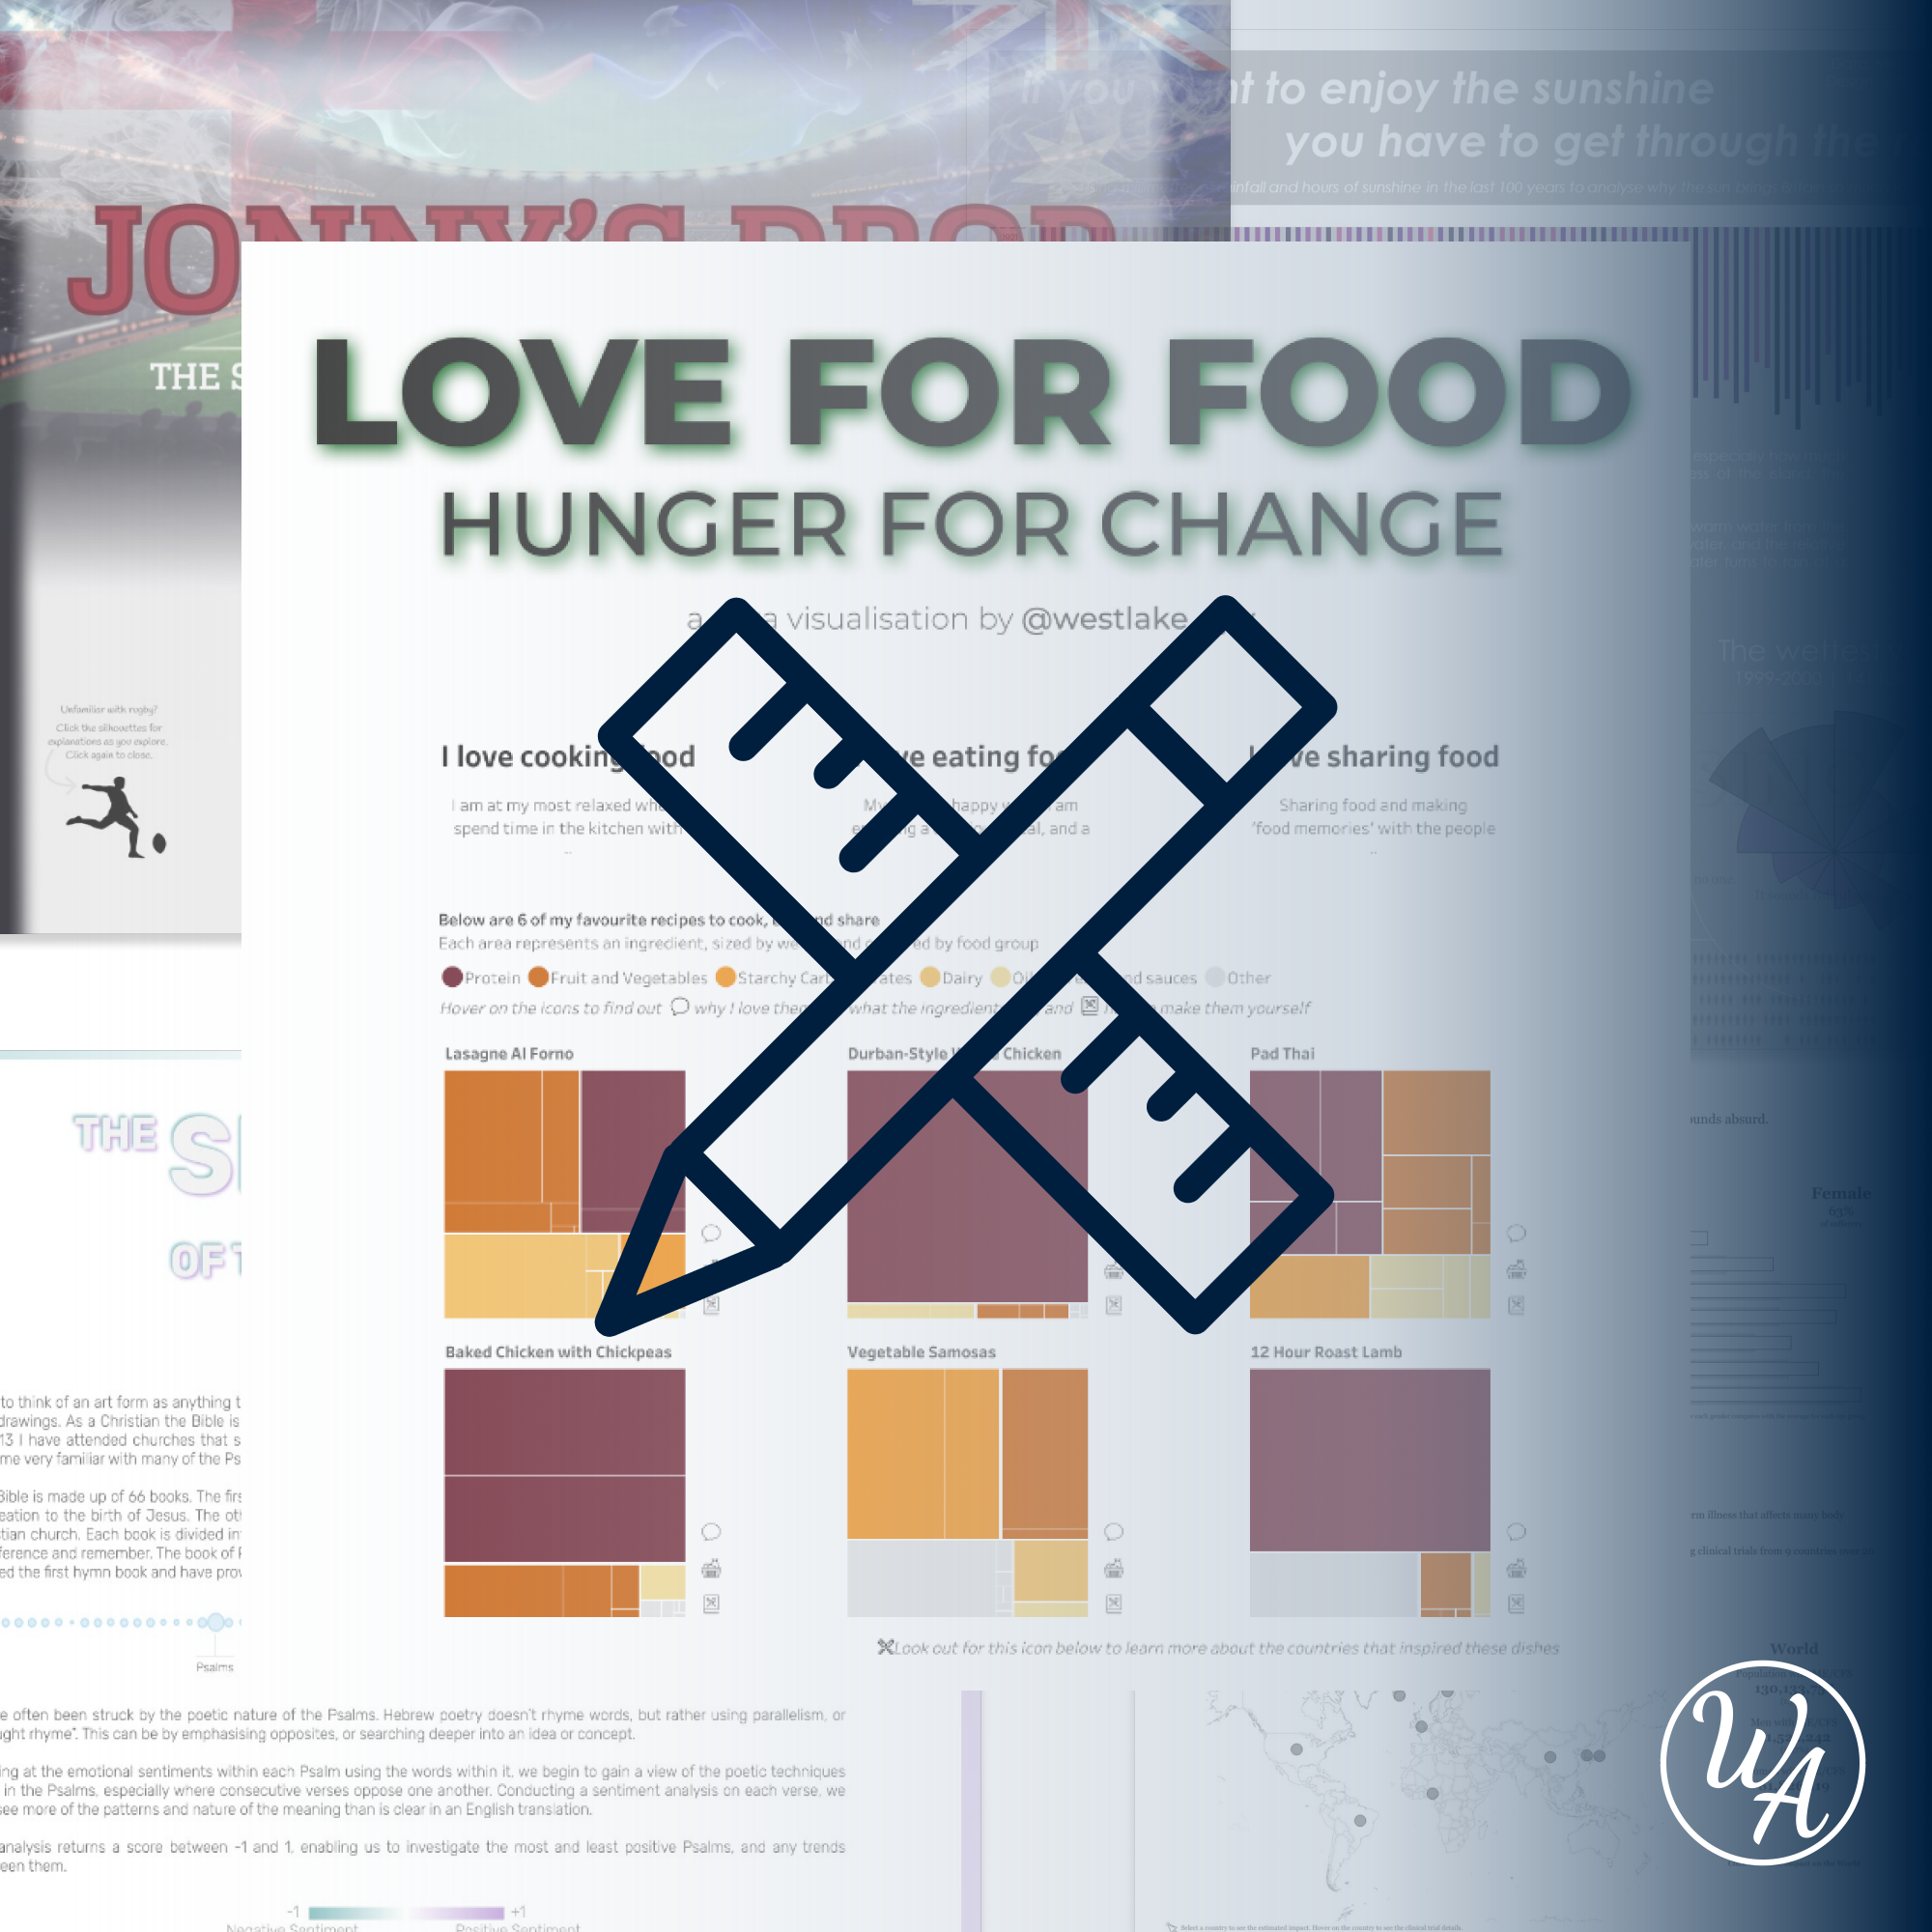
Viz What You Love
-
![]()
Creating Radial Timelines
-
![]()
2025 | A Blank Canvas
-
![]()
A Quick Tip | Dynamic Annotations
-
![]()
IronViz Qualifiers | Design
-
![]()
IronViz Qualifiers | Storytelling
-
![]()
IronViz Qualifiers | Analysis
-
![]()
IronViz Qualifiers | Ideas and Datasets
-
![Creating Tartan in Tableau]()
Creating Tartan in Tableau
-
![]()
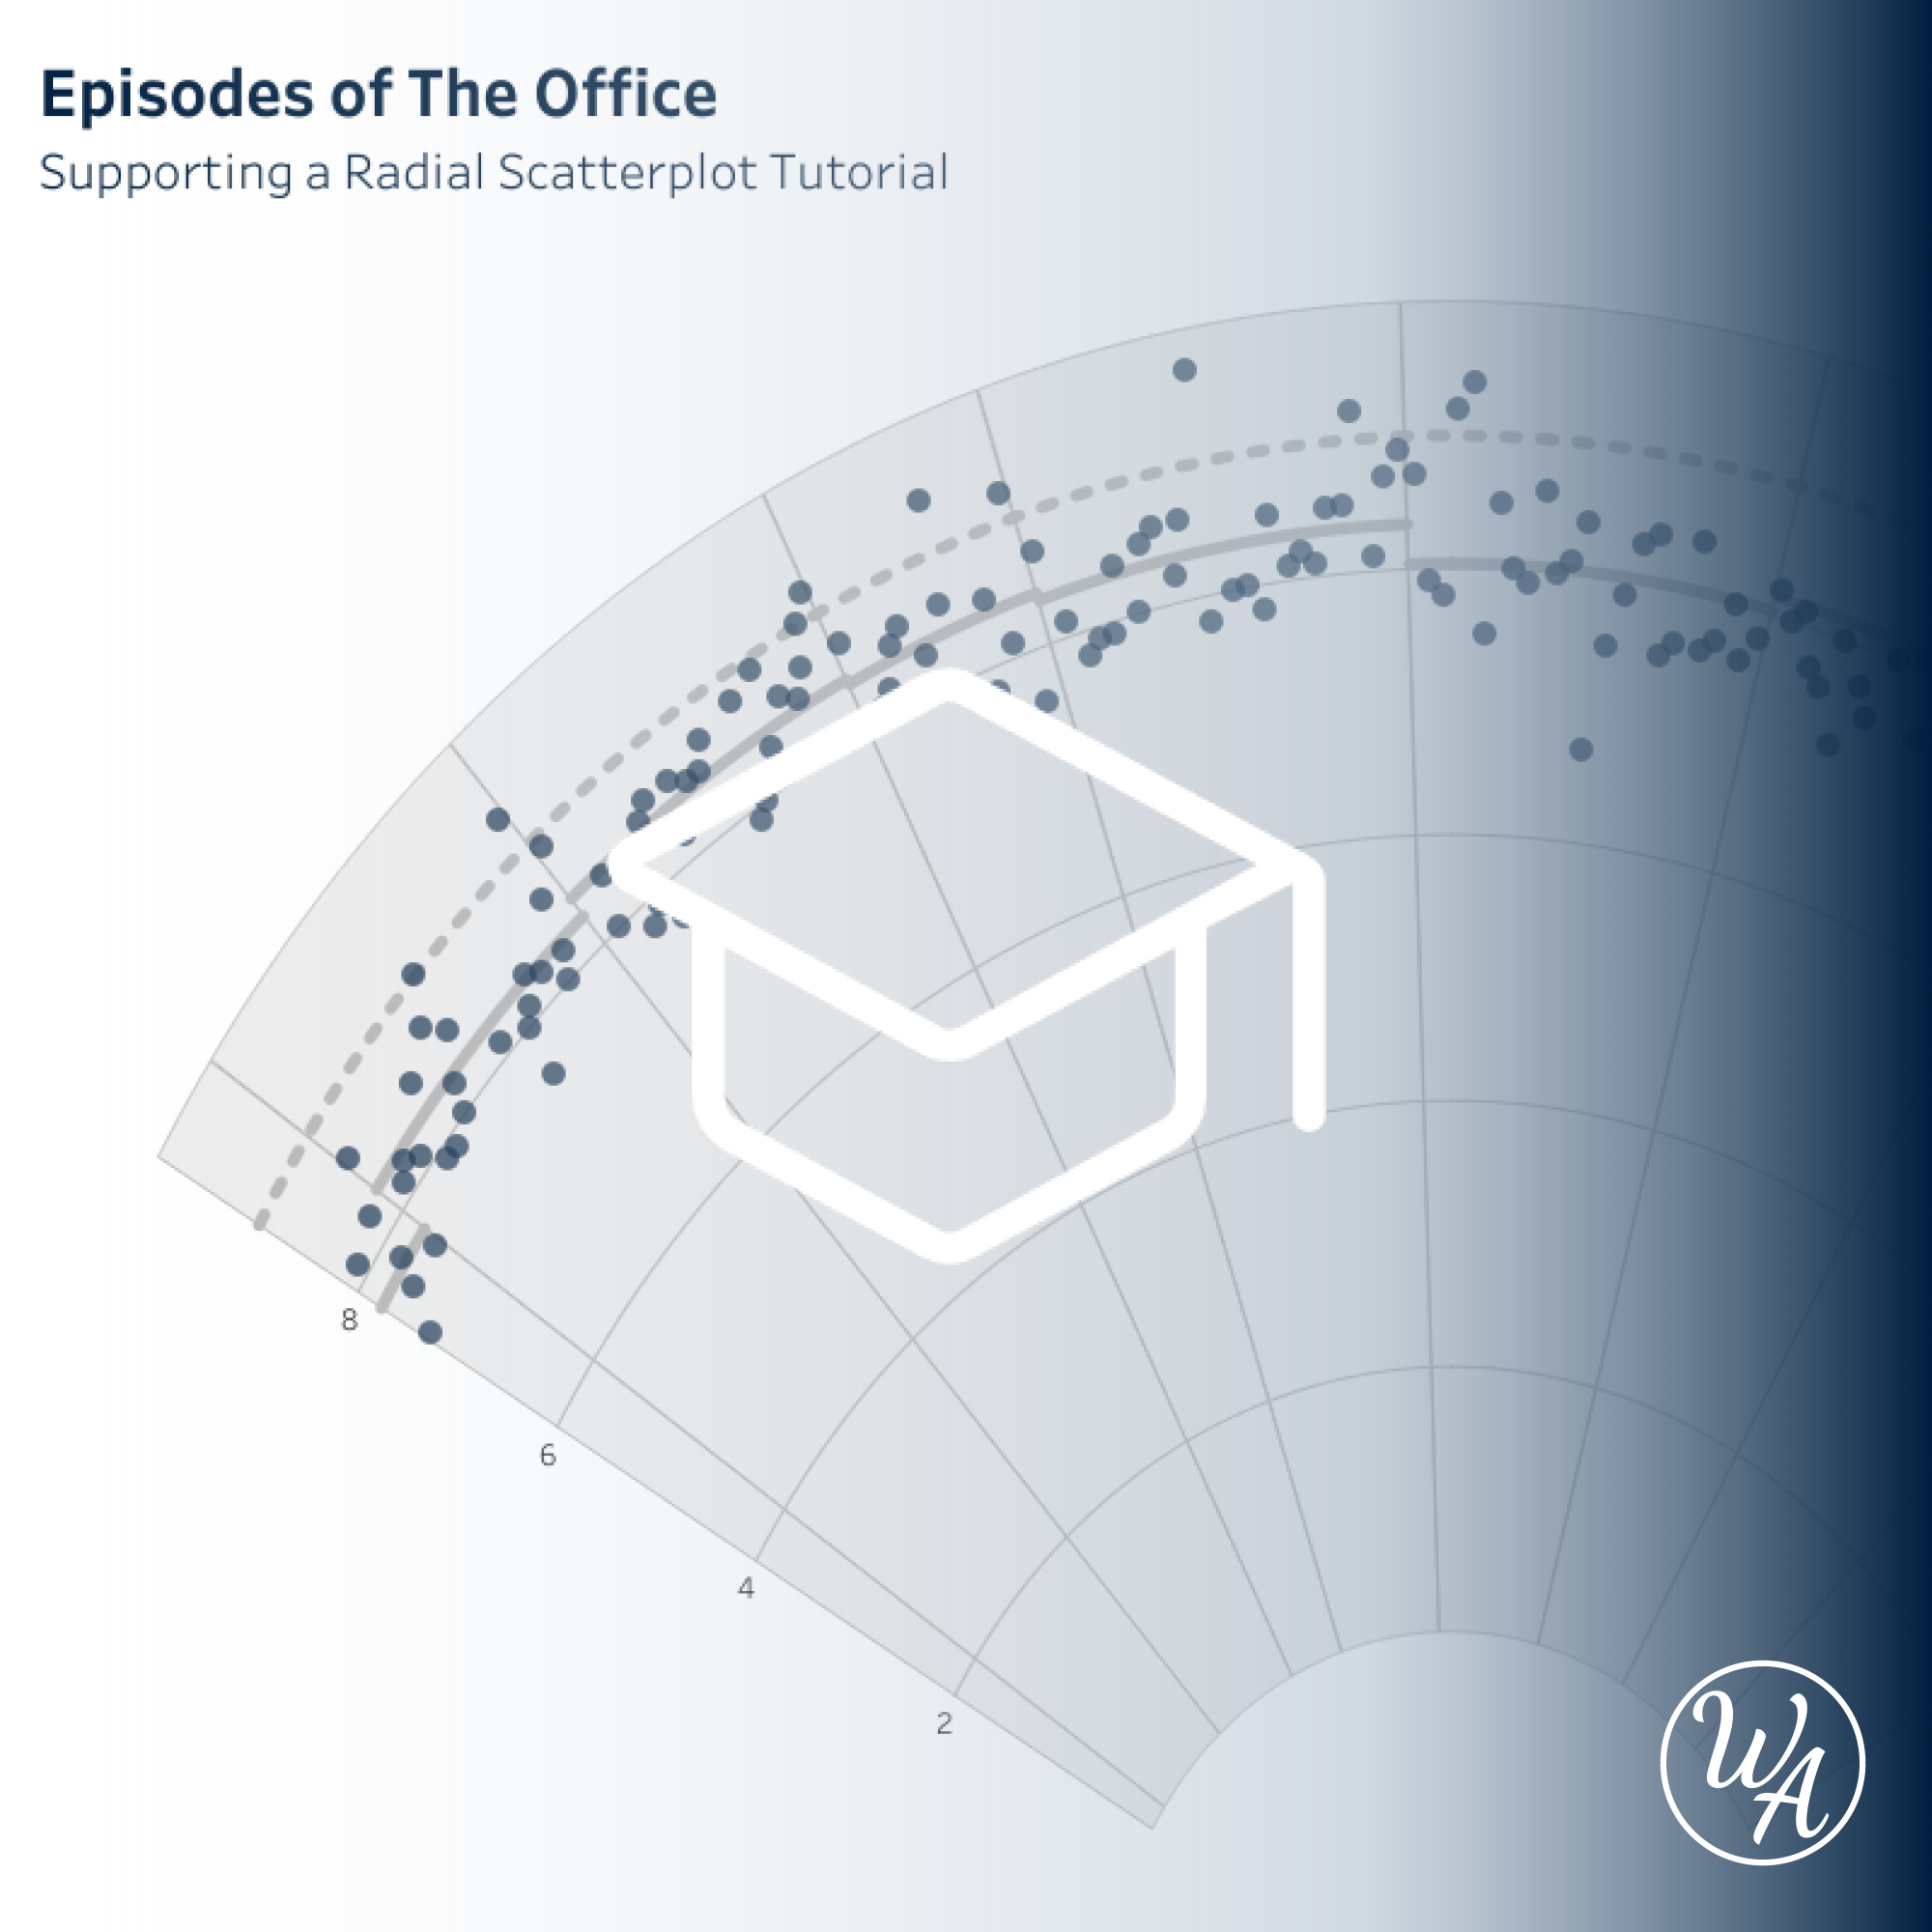
Creating Radial Scatterplots
-
![]()
Creating Slanted Bars
-
![]()
Viz Rewind | Flavour of Scotland
-
![]()
Viz Rewind | Visualising the Wimbledon Singles Finals
-
![]()
Iron Viz | A Spotlight on Storytelling
-
![]()
Iron Viz | A Spotlight on Design
-
![]()
Iron Viz | A Spotlight on Analysis
-
![]()
Becoming an Iron Viz Champion

